Every number, charted
Visitors, visits, page views, bounce rate, visit time, sales and who’s online now. Click any number to chart it against the period before.
What it is
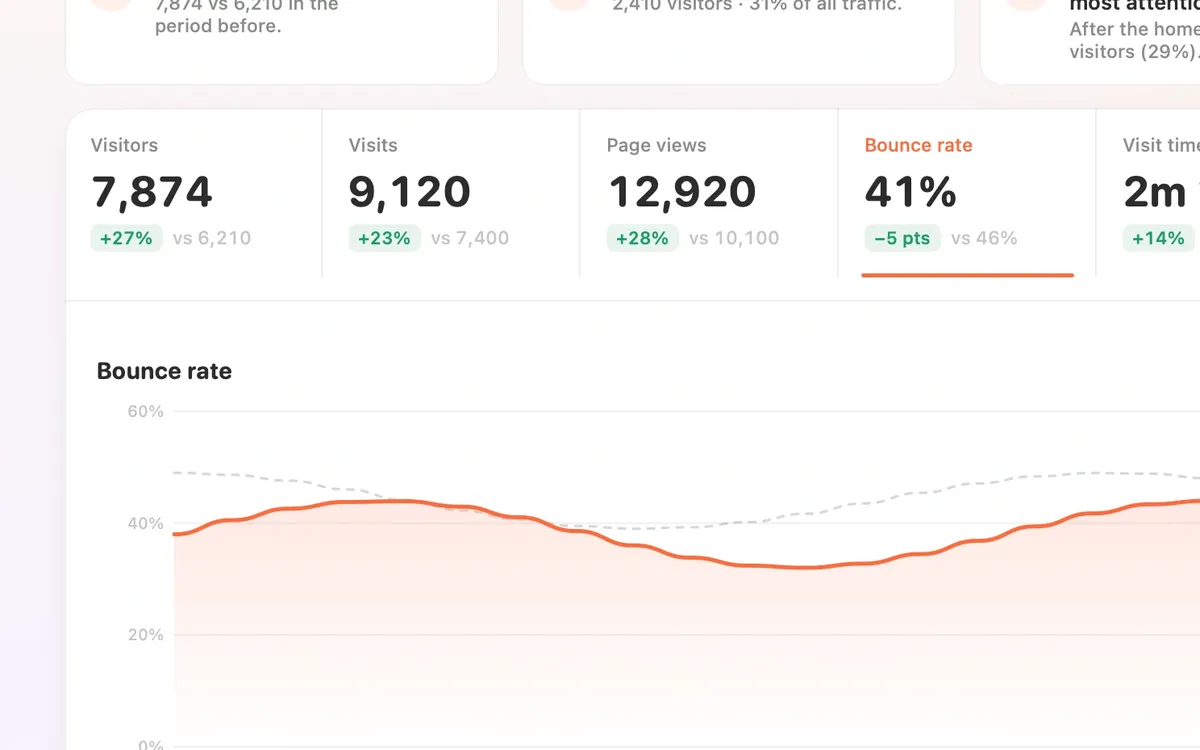
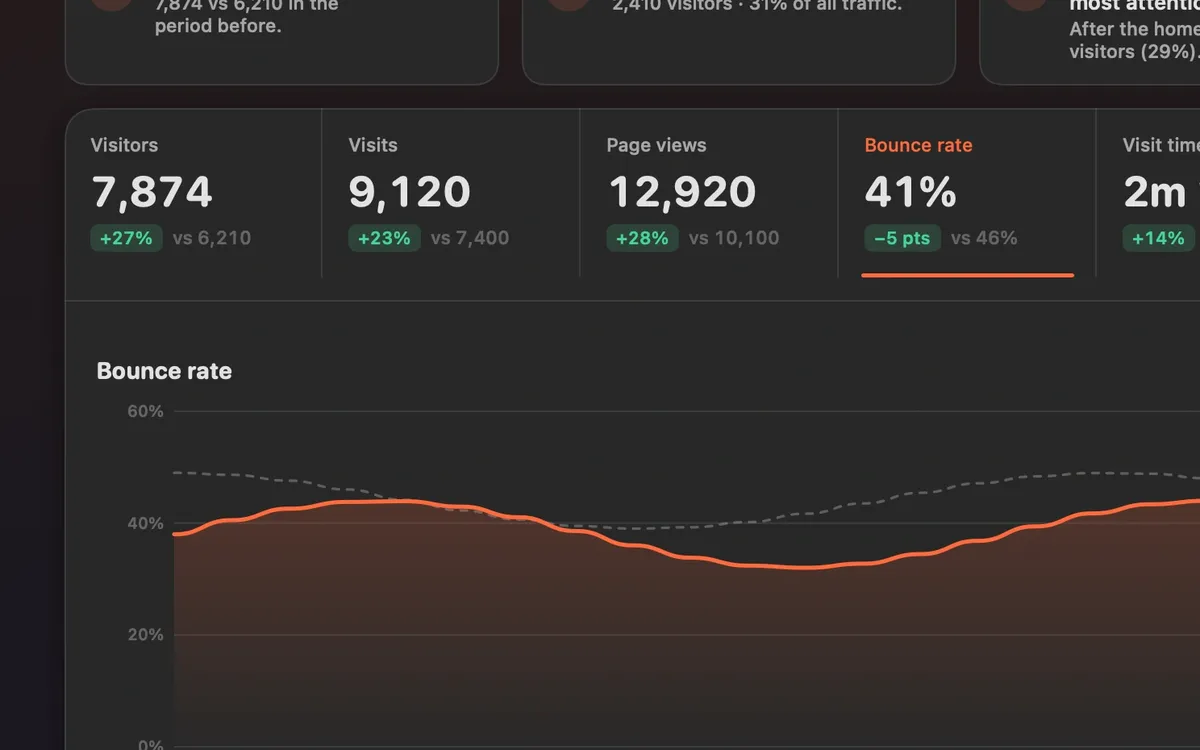
The top of Analytics is a row of numbers: Visitors, Visits, Page views, Bounce rate, Visit time and Sales, plus Online now. Each one shows how it changed against the period before.
Click a number and the chart below switches to it, with the period before as a dashed line, so you can see at a glance whether a day was really better.
Every number says what it counts. Visitors are different people, and someone who comes back the same day counts once. A visit ends after 30 minutes without a page view. Visit time counts only the time the tab was visible.
How to use it
Open Analytics
In the Clacky window, pick Dashboard in the pill switcher, then Analytics.
Pick a period
Choose Today, Yesterday, 24 hours, 7 days, 30 days, 90 days or 12 months.
Click a number
Click Visitors, Visits, Page views, Bounce rate, Visit time or Sales to chart it by day.
Compare
The solid line is this period and the dashed line is the period before. Hover the chart to read a single day.
Tips
- Online now opens the Live view: click See who’s here.
- Sales shows paid orders once you connect Polar or Stripe in the Revenue tab.
- Chart times are in UTC.
Questions
- What counts as a bounce?
- A visit that saw one page and did nothing else. Lower is better.
- Why can visitors over 7 days be higher than I expect?
- Without cookies, a visitor is counted once per day. Someone who comes back on three different days counts three times in a 7-day total.
- Do reloads count as page views?
- Yes. Page views counts every page opened, reloads included. Visitors and Visits don’t grow on a reload.
Make something on your Mac today.
Seven days free, every feature, cancel anytime.